
Please Note
This article applies to the legacy ACE dashboard interface. If your agency uses Rainmaker Insights (RI), see Understanding RI Boards: Dashboards and Report Layouts for dashboards and Understanding RI Visuals: Reports and Charts for reports.
To add or arrange reports in RI, see Creating an RI Board and Editing an RI Board.
The Dashboard displays a range of tabs and panels that pertain to collections, goals, and recent accounts.
Adding Panels
From the dashboard, Right click on the tab, then click “Add Panels”
Select the panel(s), click Add
Click Done
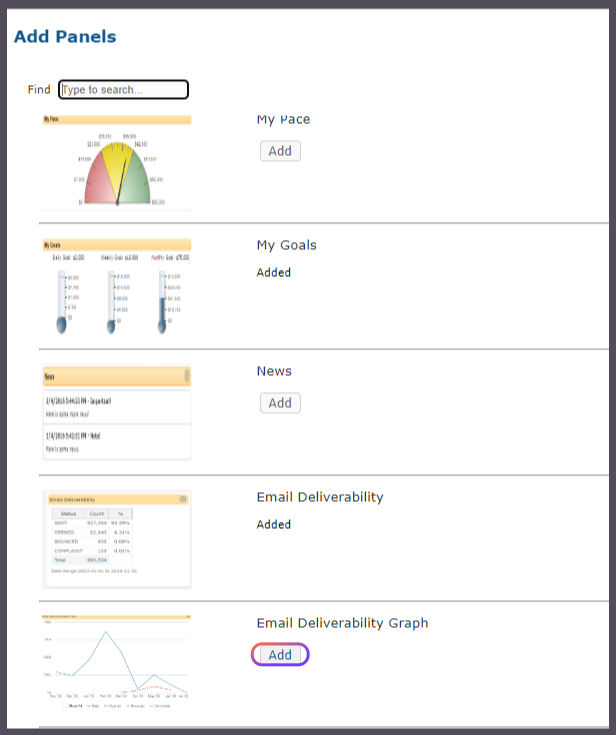
Image Displays Step 3
Editing Panels
Right Click in the panel and select “Edit”
Select Date Range
Click Done
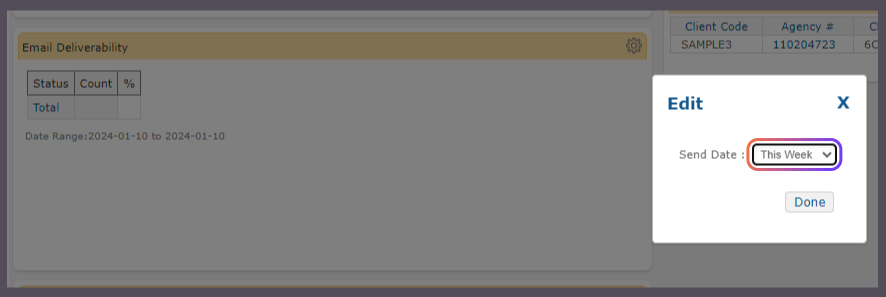
Image Displays a Send Date range for Email Deliverability
Email Deliverability Chart and Graph
Please note that the 'Email Deliverability' chart requires the Enhanced ELS Package Addon. Set a send date range (e.g., week, month) for accurate data representation.